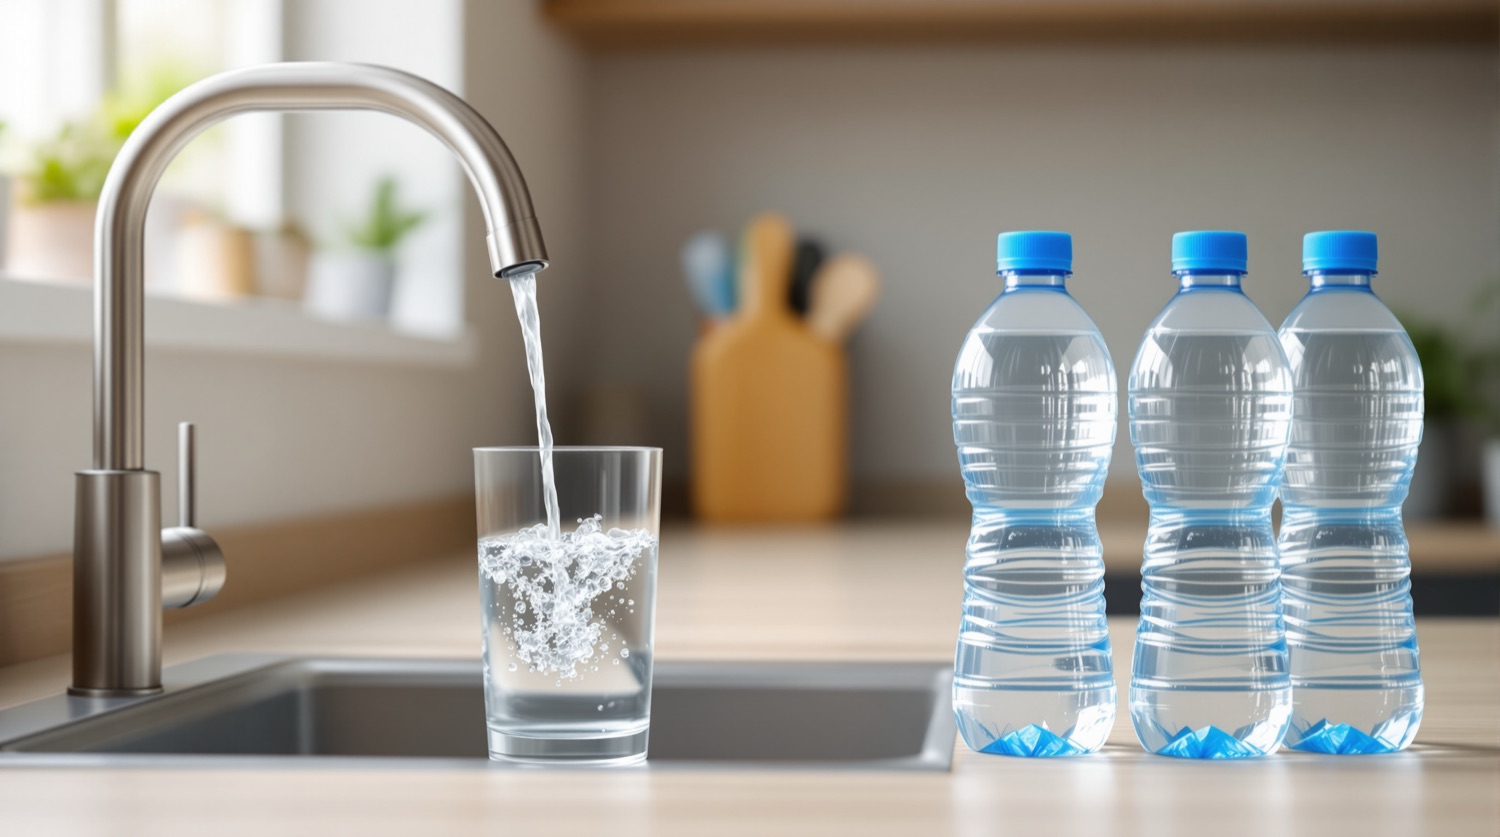
Bottled water carries far more microplastic than tap water in every study that has measured them. A 2024 study in PNAS from Columbia University and Rutgers counted about 240,000 plastic particles per liter of bottled water, roughly 90% of them nanoplastics, while a 2018 PLOS ONE survey of 159 tap-water samples from around the world averaged 5.45 particles per liter. The two used different instruments and size cutoffs, so the gap is a direction rather than an exact ratio, but a 2019 pooled analysis in Environmental Science & Technology points the same way: bottled-only drinkers take in about 90,000 extra particles a year versus roughly 4,000 for tap-only drinkers. The bottle is the source: German researchers found 84% of the particles in returnable PET bottles were PET itself. The best option is neither straight from the tap nor from the bottle. It is tap water run through a reverse-osmosis or sub-micron pitcher filter and carried in stainless steel or glass.
“Bottled water vs tap water” used to be an argument about taste, cost and lead pipes. Microplastics changed it. For the first time there is a contaminant where the bottled product is measurably worse, not because the source water is dirtier but because the package sheds into its contents. A PET bottle and a polypropylene cap are plastic sitting in water for months; the question was never whether they shed, only how much, and until recently no instrument could count the smallest pieces.
This guide lays out the five studies that put numbers on both sides: the 2024 nanoplastic count from Columbia and Rutgers, two 2018 bottled-water surveys from SUNY Fredonia and from Germany, the 2018 global tap-water survey, and the 2019 exposure model that added it all up per person per year. Then it covers why the bottle is the culprit, what the World Health Organization says about the health question, and what to drink instead.
The bottom line up front: tap water beats bottled water on microplastics by a wide margin, and filtered tap water in a steel or glass bottle beats both. Reverse osmosis is the most thorough household method; a pitcher with a published sub-micron microplastic test is the convenient one. For the deeper dives, see microplastics in water bottles, whether tap water is safe to drink, and what glass bottles were found to hold.
Which has more microplastics, bottled water or tap water?
Bottled water, by a wide margin, in every dataset that lets you compare. The most precise measurement to date is a 2024 study in PNAS by Naixin Qian, Wei Min and colleagues at Columbia University, with Rutgers toxicologist Phoebe Stapleton. Using a new laser-imaging technique (stimulated Raman scattering) that can identify individual plastic particles smaller than 100 nanometers, they estimated about 2.4 × 10⁵ particles per liter of bottled water, with an uncertainty of ±1.3 × 10⁵. Roughly 90% were nanoplastics, meaning under one micron, which the authors note is “orders of magnitude more than the microplastic abundance reported previously in bottled water.”
The best-known tap-water figure comes from a 2018 study in PLOS ONE by Mary Kosuth, Sherri Mason and Elizabeth Wattenberg (University of Minnesota and SUNY Fredonia), which tested 159 tap-water samples from around the world. It found particles in 81% of them, a mean of 5.45 particles per liter, and a range from 0 to 61. One honest caveat: that study counted mostly fibers 0.1 to 5 mm long under a microscope, while the 2024 study counted particles thousands of times smaller with a laser. The finer the instrument, the higher the count, so the two numbers are not a strict like-for-like ratio. But every method that has been applied to both kinds of water reaches the same direction, and the 2019 exposure analysis below quantifies it with matched methods.
How many microplastics are in bottled water?
It depends on how small a particle the study could see. Before 2024, the largest survey was the 2018 Frontiers in Chemistry study by Sherri Mason, Victoria Welch and Joseph Neratko at SUNY Fredonia. They tested 259 bottles from 11 brands bought in 9 countries and found microplastic contamination in 93% of them. Counting only particles larger than 100 microns, the average was 10.4 per liter; including the smaller 6.5-to-100-micron particles, the average rose to 325 particles per liter, with individual bottles ranging from zero to more than 10,000. The most common polymer they could identify was polypropylene, at 54%, which matches the material of bottle caps.
A 2018 German study in Water Research by Darena Schymanski and colleagues at the CVUA-MEL food-safety institute in Münster used micro-Raman spectroscopy, which sees particles down to about 1 micron, on 22 plastic bottles, 9 glass bottles and 3 beverage cartons. Almost 80% of the particles it found were 5 to 20 microns, a size range earlier methods missed entirely. The averages tell the packaging story in one row: 118 particles per liter in returnable plastic bottles, 14 in single-use plastic bottles, 50 in glass bottles and 11 in cartons. Both studies are summarized with the tap-water and exposure figures in the table below.
| Study | Water tested | Particles per liter | What it could see |
|---|---|---|---|
| Qian et al., PNAS 2024 (Columbia / Rutgers) | Bottled water | ~240,000 (±130,000); ~90% nanoplastics | Single particles below 100 nanometers, by laser imaging |
| Mason et al., Frontiers in Chemistry 2018 (SUNY Fredonia) | 259 bottles, 11 brands, 9 countries | 325 (all sizes counted); 10.4 (above 100 microns) | Particles 6.5 microns and up; 93% of bottles contaminated |
| Schymanski et al., Water Research 2018 (Germany) | Returnable PET / single-use PET / glass / carton | 118 / 14 / 50 / 11 | Particles 1 to 500 microns; ~80% were 5 to 20 microns |
| Kosuth et al., PLOS ONE 2018 (U. Minnesota / SUNY Fredonia) | 159 tap-water samples, worldwide | 5.45 mean (range 0 to 61) | Mostly fibers 0.1 to 5 mm; 81% of samples had particles |
| Cox et al., Environ. Sci. & Technol. 2019 (U. Victoria) | Pooled: 26 studies, 402 data points | Bottled-only: +90,000 per year; tap-only: ~4,000 per year | Per-person exposure model, same size cutoffs on both sides |
How many microplastics are in tap water?
Far fewer, in every measurement so far. The 2018 PLOS ONE survey is the anchor figure: 5.45 particles per liter on average across 159 samples, 81% of samples positive, 98.3% of the particles fibers. The same authors estimated that the average person swallows more than 5,800 synthetic particles a year from tap water, beer and sea salt combined, with tap water contributing 88% of that total, which sounds like a lot until you set it against the 90,000 extra particles a year the 2019 Environmental Science & Technology model assigned to drinking bottled water instead.
Municipal treatment is a large part of why tap water scores well. The World Health Organization's 2019 review concluded that conventional drinking-water treatment removes most particles and that wastewater treatment can remove more than 90% of microplastics, with the highest removal from filtration stages. In the United States, tap water is regulated by the EPA under the Safe Drinking Water Act, and every community system must publish an annual Consumer Confidence Report on what is in it. None of that makes tap water perfect: lead service lines and PFAS are real, local problems that our guide to whether tap water is safe to drink covers, and a filter that handles microplastics generally handles those too.
Why does bottled water have more microplastics than tap water?
Because the package is the source. The chemistry makes the case on its own: in the German Water Research study, 84% of the particles in water from returnable plastic bottles were PET, the polymer the bottle is made of, and another 7% were polypropylene, the cap material. In the SUNY Fredonia study, polypropylene was the single most common polymer at 54%, again matching the cap. The particles are not arriving with the spring water; they are coming off the container and the bottling line.
Wear multiplies it. Returnable bottles, which are washed and refilled dozens of times, held 118 particles per liter against 14 for single-use bottles in the same study, a sign that scuffing, repeated capping and hot washing free more plastic from the walls. That is the same mechanism that makes reusing a disposable plastic bottle a bad idea, and it is why heat and time in a warm car or a sunny warehouse matter. Tap water, by contrast, reaches you through metal and concrete after treatment plants that were built to remove particles. It picks up fibers along the way, which is what the tap-water study mostly found, but it never spends months sealed inside plastic.
"The particles in bottled water are not a contaminant that slipped past the bottler. They are the bottle. Four out of five particles in returnable PET bottles were PET; the most common polymer in the global bottle survey was the cap material."
Are microplastics in drinking water dangerous?
The honest answer is that the largest particles probably are not, and the smallest are an open question. The WHO's 2019 assessment, the most authoritative review to date, said that “based on the limited information we have, microplastics in drinking water don't appear to pose a health risk at current levels. But we need to find out more.” It noted that particles larger than 150 microns are unlikely to be absorbed by the body and that uptake of smaller particles is expected to be limited, while calling for more research on the very smallest, nano-sized particles.
That last category is exactly what the 2024 study found dominates bottled water: about 90% of the 240,000 particles per liter were under one micron, which the Columbia authors describe as the size most able to enter the human body. Microplastics as a class are now detected throughout the human body, in blood and organs, and the 2019 exposure model estimated the average American already ingests 39,000 to 52,000 particles a year from food alone before drinking water is counted. So the sensible read is proportion, not panic: bottled water is a large, avoidable source of the small particles researchers are most concerned about, and removing it costs almost nothing.
Every figure on this page is a particle count, not a health outcome. Different studies used different instruments, so a 2018 count and a 2024 count are not directly comparable, and no study has yet linked a specific microplastic dose in drinking water to a specific disease. What the evidence does support is the ranking: bottled water carries far more plastic than tap water, and filtered tap water carries the least of all. Act on the ranking.
What is the best way to drink water with the fewest microplastics?
Filter your tap water, then keep it out of plastic. Reverse osmosis is the most thorough household method because its membrane openings, on the order of 0.0001 micron, sit far below even the nanoplastics the 2024 study counted. A good pitcher filter with a published sub-micron microplastic test is the convenient option; a basic taste-and-odor carbon filter is not built for particles this small, which is the distinction our Brita microplastics guide works through. And whichever filter you choose, put the water in stainless steel or glass, because pouring filtered water back into a PET bottle re-creates the problem you just solved. The table ranks the everyday options from best to worst.
| How you drink it | Microplastic exposure | Why |
|---|---|---|
| Reverse-osmosis filtered tap, in glass or steel | Lowest | RO membrane (~0.0001 micron) stops particles far below nanoplastic size; no plastic container afterward |
| Sub-micron pitcher-filtered tap, in glass or steel | Very low | Makers publish 99.9% or better microplastic reduction on third-party tests; no plastic container afterward |
| Plain tap water in a glass | Low | 5.45 particles per liter mean in the 2018 global survey; treated and regulated supply |
| Glass-bottled water | Moderate | 50 particles per liter mean (0 to 253) in the 2018 German study; particles traced to caps and filling lines |
| Single-use plastic bottled water | High | 14 to 325 particles per liter in 2018 counts; ~240,000 including nanoplastics in the 2024 count |
| Returnable / reused plastic bottle | Highest measured | 118 particles per liter in the 2018 German study; 84% PET from the bottle wall |
Two more habits close the remaining gaps. If you already own a filter, check what it is actually rated for rather than what the box implies; a taste-and-odor carbon cartridge and a sub-micron membrane look identical from the outside, and only the maker’s test sheet tells them apart. And if you rely on boiling, read whether boiling removes microplastics first, because heat alone does not destroy plastic.
Filter the tap, ditch the bottle
The two moves that beat both sides of this comparison: a filter rated for sub-micron particles, and a bottle made of something that cannot shed. See the full rankings for each.
The filters and bottles that beat both
These are the specific, currently sold products that turn the comparison into a routine: a countertop reverse-osmosis purifier for the most thorough result, three pitcher filters whose makers name microplastics on their own spec sheets, and the stainless bottle to carry the result. Every microplastic figure below is the maker's published test data, labeled as such; where a claim could not be confirmed from a primary document, it is not repeated here. Prices change daily, so check the current listing.
1. AquaTru Carafe Countertop RO — Best Overall
 Best Overall
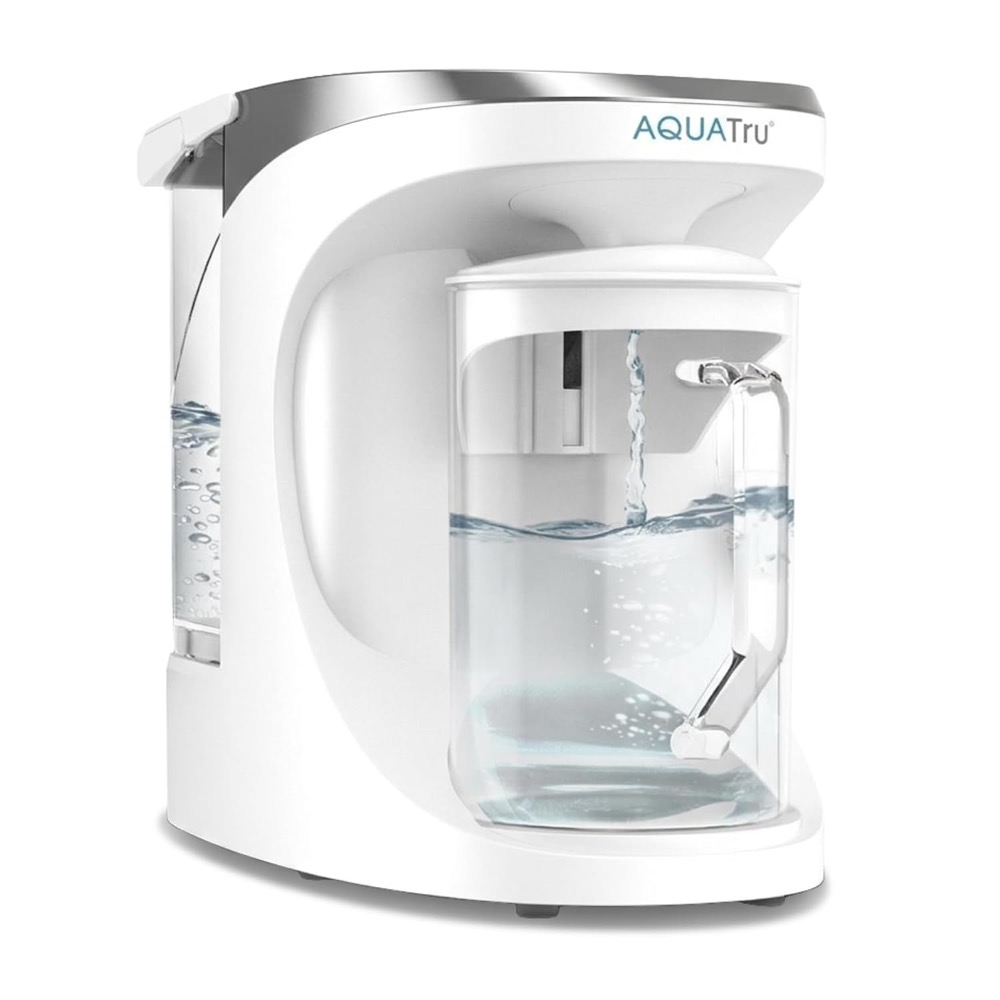
Reverse osmosis forces water through a membrane whose openings are on the order of 0.0001 micron, which puts it well below the sub-micron nanoplastics that made up about 90% of the particles in the 2024 PNAS count. The Carafe version matters for this comparison for a second reason: the purified water lands in a glass carafe, so there is no plastic reservoir to re-introduce what the membrane just removed. Our full water-filter ranking covers its certifications and running costs in detail.
Tap water taken below the nanoplastic size range, with nothing to install and nothing plastic holding the finished water.
Why it's safe: Reverse osmosis is a physical barrier at roughly 0.0001 micron, far below the particle sizes any drinking-water study has measured, and the collection vessel is glass.
Check Today's Price on Amazon →Amazon prices change daily — tap to see today's price and any active discount.
- Free delivery for Prime members
- Thousands of verified reviews
- Easy 30-day returns
2. Epic Pure Pitcher — Best Pitcher
 Best Pitcher
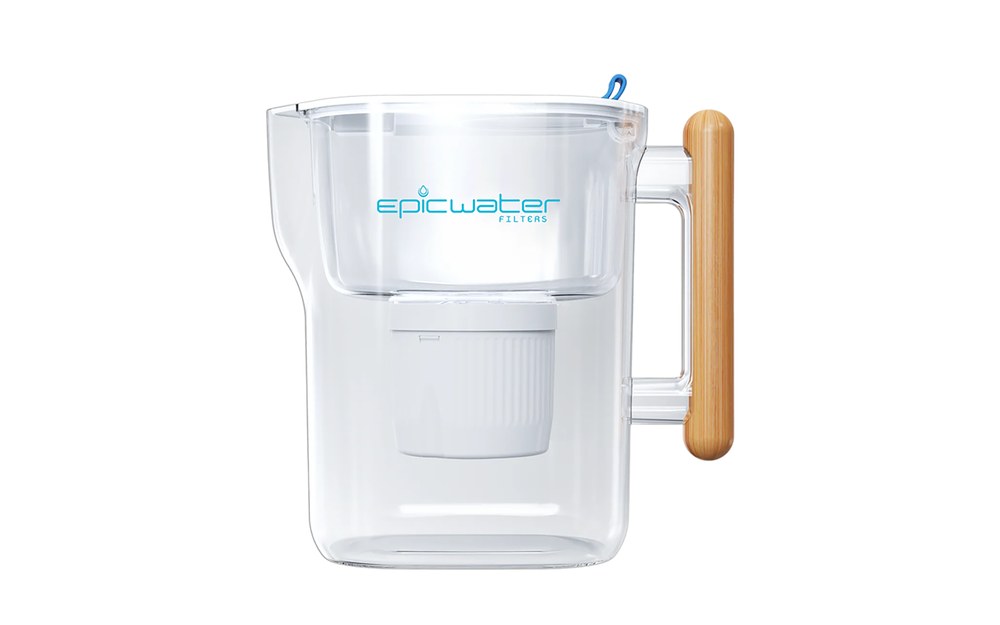
Epic Water Filters lists microplastics among the contaminants the Pure pitcher reduces and publishes a 99.9% reduction figure for them, alongside PFAS, fluoride, lead and chlorine. The company states the filter is NSF 42 certified for material safety and that its PFAS performance was tested against NSF/ANSI/CAN 53 criteria. Each cartridge is rated for 100 gallons, which the maker frames as more than 2,000 single-use bottles avoided. For the pitcher-by-pitcher comparison, see the best water filter pitchers for microplastics.
Fill it from the tap, keep it in the fridge, and stop buying the bottles that are the plastic source in the first place.
Why it's safe: The maker's published data puts microplastic reduction at 99.9%, the pitcher body is stated to be BPA/BPS-free, and the filter is NSF 42 certified for the materials it is made from.
Check Today's Price on Amazon →Amazon prices change daily — tap to see today's price and any active discount.
- Free delivery for Prime members
- Thousands of verified reviews
- 100-gallon cartridge life
3. Clearly Filtered Water Pitcher — Most Published Test Data
 Most Published Test Data
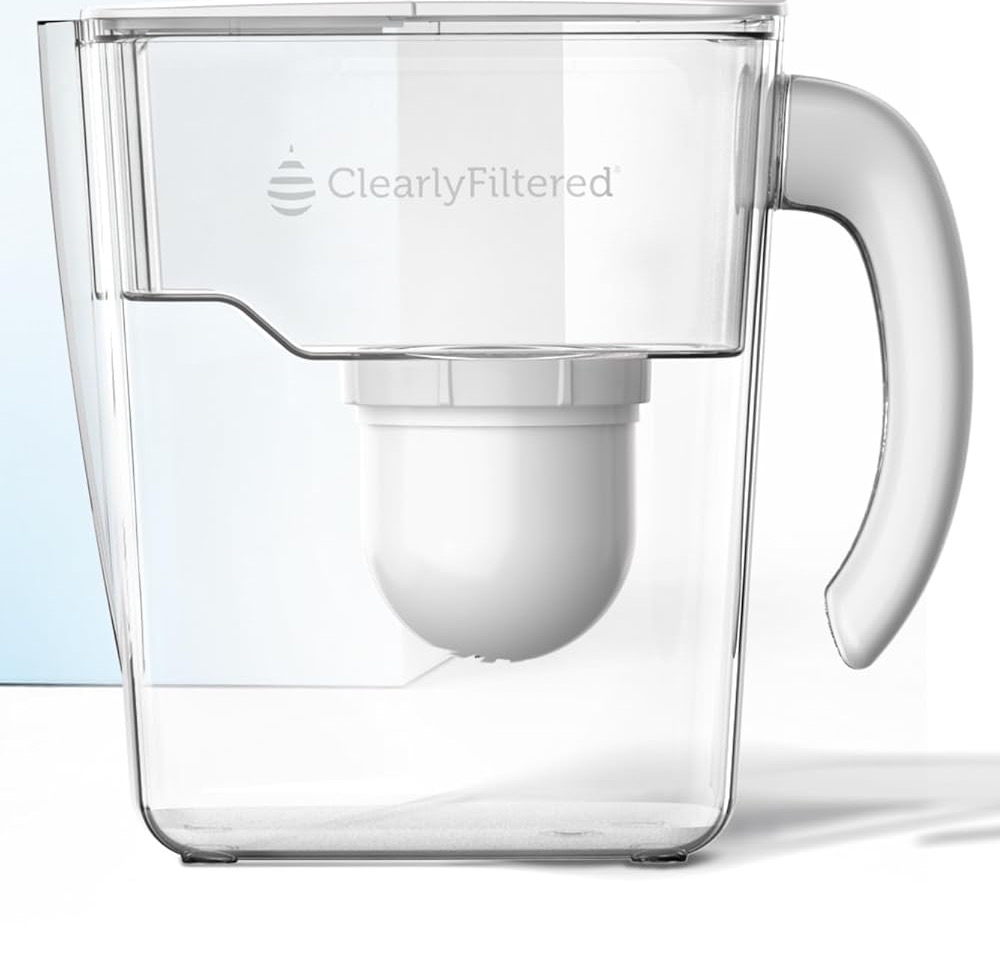
Clearly Filtered publishes third-party test results for its pitcher line by contaminant. For microplastics the sheet lists a challenge concentration of 50,000,000 particles per liter reduced to fewer than 1, which the company reports as greater than 99.99% removal. Whatever you make of a single lab run, it is a specific, checkable claim, which is more than most pitchers offer. Pair it with a stainless bottle for the road and the bottled-water habit has nothing left to do. Our PFAS filter guide covers how the same cartridge handles forever chemicals.
A pitcher filter with the microplastic test result written down, from 50 million particles per liter to under one.
Why it's safe: The maker's published third-party data shows more than 99.99% microplastic reduction, and the filtered water sits in the pitcher rather than a single-use PET bottle.
Check Today's Price on Amazon →Amazon prices change daily — tap to see today's price and any active discount.
- Free delivery for Prime members
- Thousands of verified reviews
- Easy 30-day returns
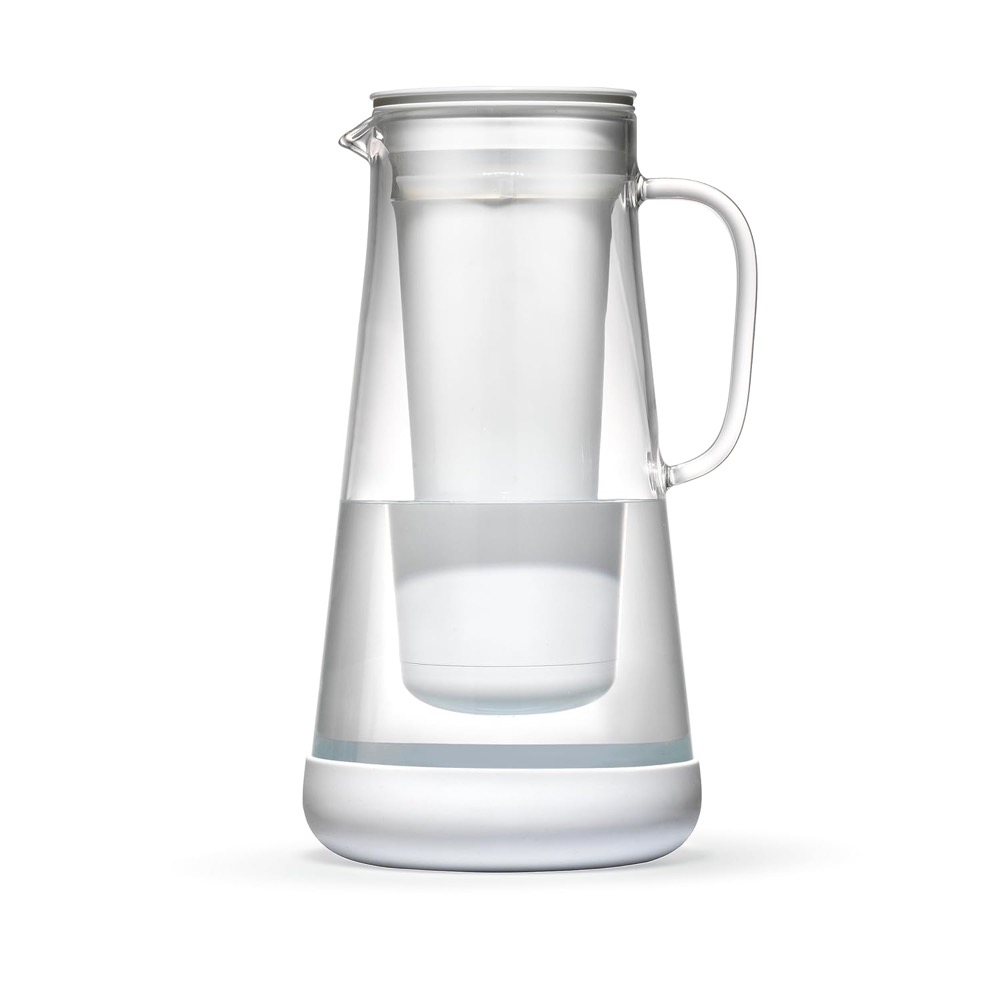
4. LifeStraw Home Pitcher — Best Value Pitcher
 Best Value Pitcher
LifeStraw built its name on hollow-fiber membranes for the field, and the Home pitcher brings a membrane microfilter indoors. The company's own product listing names microplastics, PFAS, lead, mercury, chlorine, bacteria and parasites among what the pitcher filters. Because a membrane is a physical barrier rather than a chemical one, it is the right technology for the fragments and fibers the 2018 tap-water study found. It is the pick if the premium pitchers stretch the budget.
Membrane filtration for tap water at a price that makes bottled water the expensive option.
Why it's safe: The maker lists microplastics explicitly among the contaminants the Home pitcher filters, using a physical membrane rather than a taste-only carbon block.
Check Today's Price on Amazon →Amazon prices change daily — tap to see today's price and any active discount.
- Free delivery for Prime members
- Thousands of verified reviews
- Easy 30-day returns
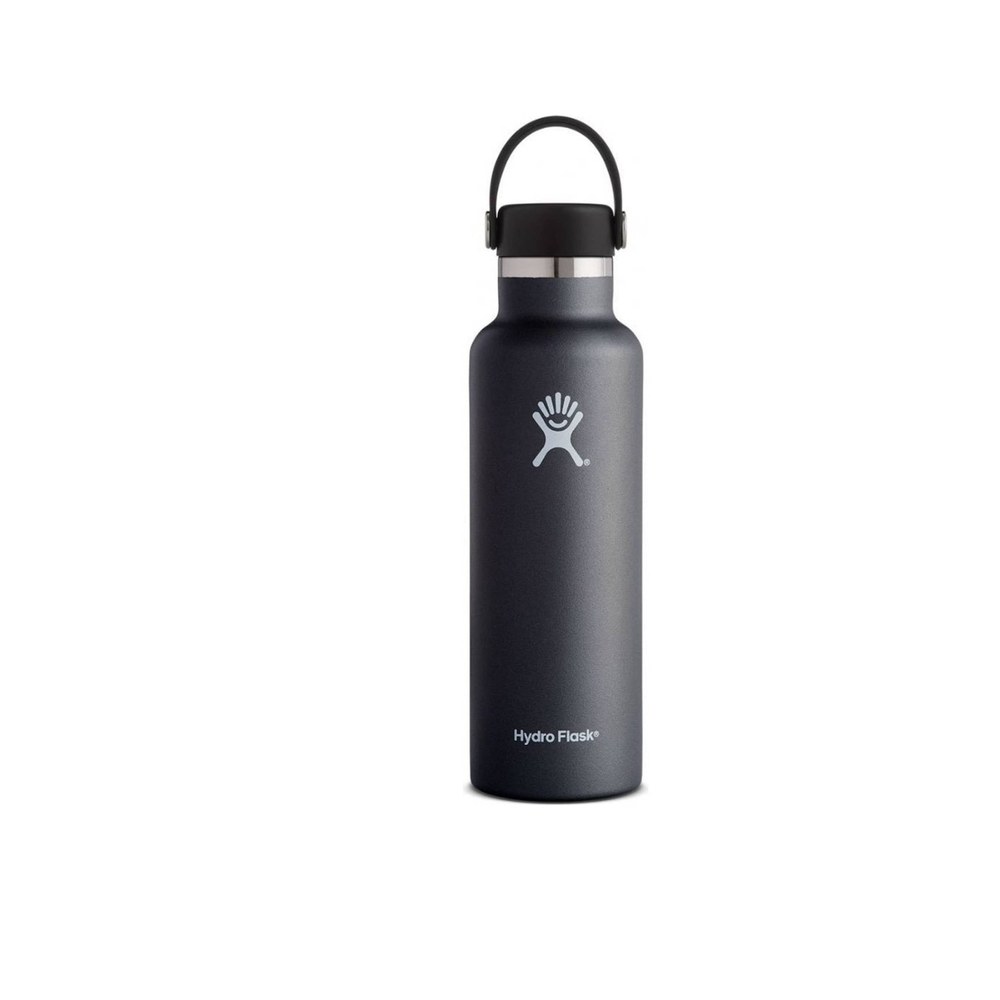
5. Hydro Flask Standard Mouth 21 oz — Best Bottle to Carry It
 Best Bottle
Every bottled-water study on this page traces the particles to the container: PET from the bottle wall, polypropylene from the cap. A stainless steel bottle removes both. Hydro Flask's Standard Mouth is 18/8 pro-grade stainless with no interior liner, so the only thing touching your water is steel, and the double-wall vacuum keeps filtered tap water cold through a workday. For the glass and steel field, see the best plastic-free water bottles.
Take filtered tap water with you without putting it back in the material that sheds.
Why it's safe: Unlined 18/8 stainless steel has no PET wall and no plastic interior to shed the particles the bottled-water studies identified.
Check Today's Price on Amazon →Amazon prices change daily — tap to see today's price and any active discount.
- Free delivery for Prime members
- Thousands of verified reviews
- Easy 30-day returns
Want the Full Home Protection Guide?
Drinking water is one plastic touchpoint among dozens in a typical home. The Complete Plasticproof Guide covers every room — kitchen, nursery, bathroom, bedroom — with 80+ product recommendations backed by 47+ studies.
The honest verdict
Bottled water vs tap water is not close on microplastics. The 2024 PNAS study counted about 240,000 particles per liter of bottled water, 90% of them nanoplastics; the 2018 global tap-water survey averaged 5.45 per liter with coarser tools; and the 2019 exposure model, which applied the same yardstick to both, put bottled-only drinkers roughly 90,000 particles a year above tap-only drinkers. The German packaging study explains why: the particles are PET and polypropylene, the bottle and its cap. None of this is proof of harm at these doses, and the WHO has said so plainly. It is proof of a ranking.
The practical response follows from the ranking. Drink tap water, run it through a reverse-osmosis system or a pitcher with a published sub-micron microplastic test, and carry it in stainless steel or glass. That setup costs less per year than a bottled-water habit, removes the single largest avoidable source of nanoplastics in most people's diets, and handles the lead and PFAS worries about tap water at the same time. For everything else in the room, the kitchen plastic detox guide picks up where the water glass leaves off.
Start with the water you drink most
A filter rated for sub-micron particles plus a bottle that cannot shed is the whole fix. Compare the certified filters, then pick the bottle that fits your day.
Frequently Asked Questions
In the studies that have measured them, bottled water carries far more. A 2024 PNAS study from Columbia and Rutgers counted about 240,000 plastic particles per liter of bottled water, roughly 90% of them nanoplastics, while a 2018 PLOS ONE survey of 159 tap-water samples averaged 5.45 particles per liter. The two studies used different methods and particle-size cutoffs, so the gap is not a precise ratio, but a 2019 pooled analysis in Environmental Science & Technology reached the same direction: people who drink only bottled water take in roughly 90,000 extra particles a year versus about 4,000 for tap-only drinkers.
By the 2024 PNAS count of about 240,000 particles per liter, a standard 16.9-ounce (500 ml) bottle would hold on the order of 120,000 micro- and nanoplastic particles. Earlier work that could only see larger particles found far fewer: a 2018 Frontiers in Chemistry study of 259 bottles from 11 brands averaged 325 particles per liter counting everything above 6.5 microns, and 10.4 per liter above 100 microns. The number rises as the instruments get better at seeing small particles.
Usually some. The 2018 PLOS ONE study found particles in 81% of 159 tap-water samples collected around the world, with a mean of 5.45 particles per liter and a range of 0 to 61. Almost all (98.3%) were fibers between 0.1 and 5 mm long. The World Health Organization's 2019 review noted that conventional drinking-water treatment removes most particles and that wastewater treatment can remove more than 90% of microplastics.
For microplastics specifically, tap water wins clearly. For everything else, it depends on your local supply: US tap water is regulated by the EPA under the Safe Drinking Water Act and every utility must publish an annual water-quality report, but lead pipes and PFAS are real local concerns. The setup that handles both is tap water run through a reverse-osmosis system or a sub-micron pitcher filter and carried in a stainless steel or glass bottle.
The right kind does. Reverse osmosis pushes water through a membrane with openings on the order of 0.0001 micron, far smaller than the nanoplastics the 2024 study counted, so RO is the most thorough household option. Several pitcher filters publish third-party test data showing microplastic reduction above 99.9%, though a basic taste-and-odor carbon filter is not built for particles that small. Boiling does not remove plastic on its own.
Some, but generally less than plastic. In a 2018 Water Research study of German mineral waters, glass bottles averaged 50 particles per liter (range 0 to 253) versus 118 in returnable plastic bottles, with the plastic-bottle particles being 84% PET, the bottle material itself. Glass bottles still have a plastic-lined cap and are filled on plastic lines, which is where their particles are thought to come from.
Sources
- Qian N, Gao X, Lang X, Deng H, Bratu TM, Chen Q, Stapleton P, Yan B, Min W. "Rapid single-particle chemical imaging of nanoplastics by SRS microscopy." Proceedings of the National Academy of Sciences, 2024;121(3):e2300582121. doi:10.1073/pnas.2300582121. (Columbia University and Rutgers; estimated about 2.4 ± 1.3 × 10⁵ micro- and nanoplastic particles per liter of bottled water, about 90% of them nanoplastics.)
- Mason SA, Welch VG, Neratko J. "Synthetic Polymer Contamination in Bottled Water." Frontiers in Chemistry, 2018;6:407. (259 bottles from 11 brands in 9 countries; 93% contaminated; 10.4 particles per liter above 100 microns and 325 per liter including 6.5-to-100-micron particles; polypropylene the most common polymer at 54%.)
- Kosuth M, Mason SA, Wattenberg EV. "Anthropogenic contamination of tap water, beer, and sea salt." PLOS ONE, 2018;13(4):e0194970. (159 globally sourced tap-water samples; 81% contained particles; mean 5.45 particles per liter, range 0 to 61; 98.3% fibers.)
- Schymanski D, Goldbeck C, Humpf HU, Fürst P. "Analysis of microplastics in water by micro-Raman spectroscopy: Release of plastic particles from different packaging into mineral water." Water Research, 2018;129:154–162. PubMed record. (Returnable plastic bottles 118 ± 88 particles per liter; single-use plastic 14 ± 14; glass 50 ± 52; cartons 11 ± 8; 84% of particles in returnable bottles were PET.)
- Cox KD, Covernton GA, Davies HL, Dower JF, Juanes F, Dudas SE. "Human Consumption of Microplastics." Environmental Science & Technology, 2019;53(12):7068–7074. (Estimated 39,000 to 52,000 particles a year from food; bottled-only drinkers ingest an additional ~90,000 particles a year versus ~4,000 for tap-only drinkers.)
- World Health Organization. "WHO calls for more research into microplastics and a crackdown on plastic pollution." News release, 22 August 2019, and the report "Microplastics in drinking-water" (2019). (Current levels do not appear to pose a health risk; particles above 150 microns unlikely to be absorbed; wastewater treatment can remove more than 90% of microplastics.)
- US Environmental Protection Agency. "Consumer Confidence Reports (CCR)." (Annual water-quality reports every US community water system must provide to its customers under the Safe Drinking Water Act.)